 |
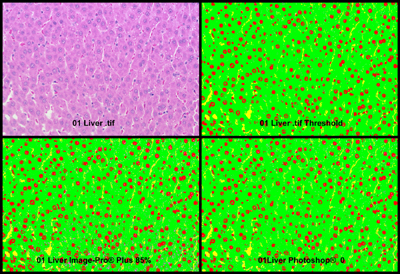
| Figure 4. Segmentation mask demonstrating image analysis output. Image analysis thresholding identifies nuclei (red) cytoplasmic (green) and sinusoidal space (yellow) in the rat liver images. |
|
| Figure 4. Segmentation mask demonstrating image analysis output. Image analysis thresholding identifies nuclei (red) cytoplasmic (green) and sinusoidal space (yellow) in the rat liver images. |