|
Camillia Matuk, M.Sc.
Authors Note: The purpose of some of the illustrations is merely to portray a sense of the topography of the various elements rather than the necessity that the elements be legible.
The theory of evolution is recognized as one of the great unifying principles of science. Yet, it continues to be widely misunderstood and contested by the public. Through an analysis of a selection of images about evolution from a range of historical and social contexts, this article discusses how the creation of illustrations and how viewers interpret them are often influenced by bodily experiences, by ancient philosophies of the natural world, and by the iconic power of images.
The affinities of all the beings of the same class have sometimes been represented by a great tree. I believe this simile largely speaks the truth... As buds give rise by growth to fresh buds, and these, if vigorous, branch out and overtop on all sides many a feebler branch, so by generation I believe it has been with the great Tree of Life, which fills with its dead and broken branches the crust of the earth, and covers the surface with its ever branching and beautiful ramifications (Charles Darwin 1859).
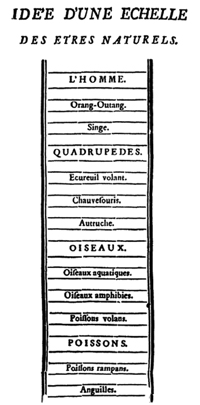
Figure 1a. Bonnett, C. 1745. The Chain of Being. In Traité d'Insectologie, premier parte. Paris: Durand. This diagram, originally meant to be a single long sequence, has been divided into two parts for ease of viewing. It shows the elements fire, air, water and earth at the bottom, followed by metals, minerals, rocks, plants, insects, snakes, fish, birds, and quadrupeds. After monkeys and orang-utans, the chain culminates in man.
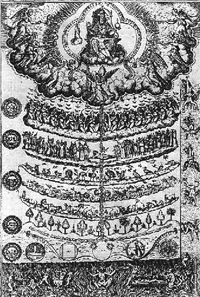
Figure 1b.The Great Chain of Being, by Fray Diego de Valades, Rhetorica Christiana (1579). Reading this illustration from bottom to top, hell and sinners occupy the lowermost ranks, followed by the plants, animals, and elements of an earthly paradise. Above them are humans, then the angels who await their turns to enter heaven. Seated on a throne at the highest point is God.
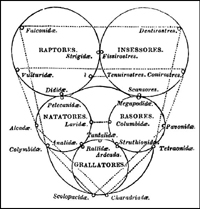
Figure 2. Affinities and analogies among birds. From Swainson, W. 1836-1837. On the natural history and classification of birds. 2 vols. London: Longman, Rees, Orme, Brown, Green, and Longman.
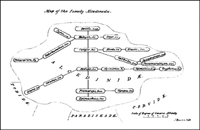
Figure 3. Map of the affinities of the kingfisher family (Alcedinidae). From Strickland, H. E. 1841. On the true method of discovering the natural system in zoology and botany. Annual Magazine of Natural History, 6: 184-194.
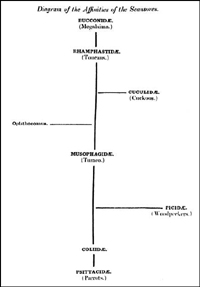
Figure 4. Diagram of the affinities of the Scansorial birds. From Wallace, A.R. 1856. Attempts at a natural arrangement of birds. Annual Magazine of Natural History, 18: 193-216.
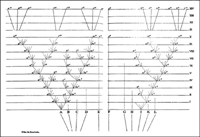
Figure 5. Diagram by Charles Darwin. From Darwin, C. 1859. On the Origin of Species. J. Carroll, ed. 2003. Peterborough, ON: Broadview Texts.
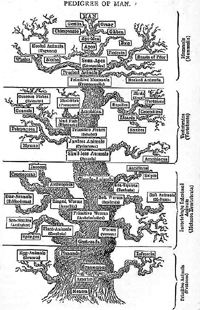
Figure 6. Pedigree of Man, by Ernst Haeckel. From Haeckel, E. 1863. The Evolution of Man: A Popular Exposition of the Principal Points of Human Ontogeny and Phylogeny, New York.
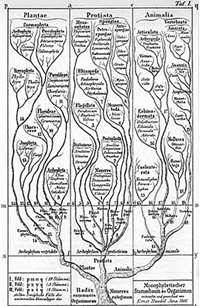
Figure 7. Stem-Tree of Organisms, by Ernst Haeckel. From Haeckel, E. 1866. General Morphology of Organisms.
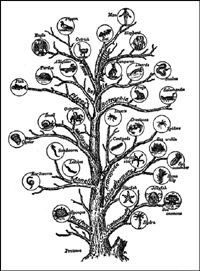
Figure 8. Family tree diagram. From Gruenberg, B. C. 1929. The story of evolution: Facts and theories on the development of life. Garden City.
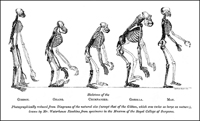
Figure 9. The Evolution of Man. From Huxley, T. H. 1863. Man's place in nature. New York: D. Appleton and Company.
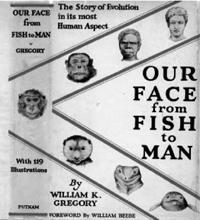
Figure 10. Dustcover. From Gregory, W. K. 1929. Our face from fish to man: A Portrait gallery of our ancient ancestors and kinsfolk together with a concise history of our best features. New York.
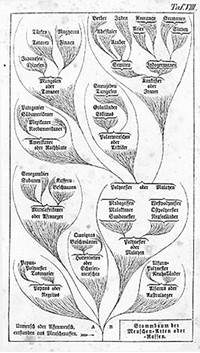
Figure 11. Stem-Tree of Human Races, 1868, by Ernst Haeckel. On the lower left branch are New Guineans, Australian Aborigines are on the lower right branch. South Africans and others are below Jews and Germans, who are at the top.
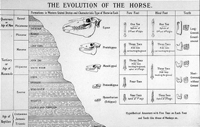
Figure 12. Horse Evolution, 1902. Courtesy American Museum of Natural History, New York. Neg. no. 35522.
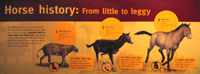
Figure 13a. Horse Evolution panel, 2007. Photograph by the author, from The Evolving Planet exhibit at the Field Museum in Chicago. The design of this panel shows a simplified representation of horse evolution by masking complexities and displaying only general trends. But in so doing, what message does the less informed viewer take away?

Figure 13b.“Grasslands spread so hoofed animals transformed,” display, 2007. Photograph by the author, from The Evolving Planet exhibit at the Field Museum in Chicago. Linear arrangements of displays such as this one often seem unavoidable. However, designers must be aware of the interpretations viewers may make. Do viewers see the specimens as examples of a diversity of adaptations to a single environment? Or do they see a progression from primitive to more sophisticated animals?
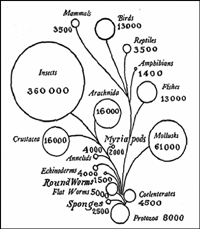
Figure 14. Diagram from Hunter, G. W. 1914. A Civic Biology Presented in Problems, New York, p.194.
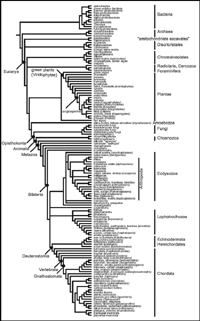
Figure 15. Tree of life. Modified from Cracraft, J. and M. J. Donoghue. 2004. Assembling the tree of life: where we stand at the beginning of the 21st century. In J. Cracraft and M. J. Donoghue, eds. Assembling the tree of life (pp. 553-561). New York: Oxford University Press. Courtesy of J. L. Cracraft and M.J. Donoghue.
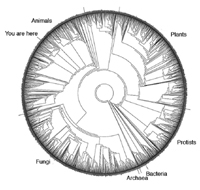
Figure 16. Tree of Life constructed from rRNA analysis of 3000 species. Courtesy of David M. Hillis, Derrick Zwickl, and Robin Gutell, University of Texas. (accessed May 23, 2007).
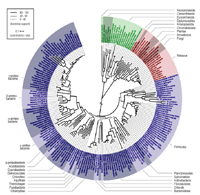
Figure 17. A Phylogeny of Complete Genomes: Data Repository. http://www.bork.embl.de/tree_of_life/ (accessed May 23, 2007). Image courtesy of the Bork Group - Comparative Systems Analysis.
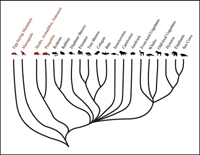
Figure 18. An animal phylogeny, 2007. Photograph and digital adaptation by the author, from The Evolving Planet Exhibit, Field Museum of Chicago.
|
Introduction
There has likely never been a scientific idea as controversial to such a wide disciplinary and cultural cross-section of people as the theory of evolution through natural selection. It is at once vehemently contested (Gallup Poll, News Release, June 5, 2006), deeply misunderstood (Diamond 2006), and enthusiastically touted as one of the great unifying theories of science (NSES 1996). Not surprisingly, imagery of evolution today richly spans media, mode, and context. Reference to it is readily found in textbooks, museums, magazines, comic strips, movies, and coffee mugs; and it is subject to discussions not only of science, but also of religion, politics, philosophy, and education.
Many recognize the effectiveness of visual over verbal modes to communicate complex science (Lynch 1990; Novick and Catley 2000). However, as will be discussed, the viewer's interpretation of an image will be influenced by context and prior conceptions (Alters and Nelson 2002), and often in spite of the intentions of the image-maker. The image-maker is moreover not immune to cultural biases (Clark 2001). In fact, public misconceptions of science and of natural selection stubbornly persist (Alters and Nelson 2002; Brumby 1984), including the belief that evolution is a linear and directed progression toward an ultimate goal, that organisms become increasingly complex as they evolve, and that humans are the superior and desired culmination of evolution (Green and Shapley 2005). Graphically, such concepts of deep time, ancestry, and genetic divergence require a rich and highly defined symbolic language, the reading of which depends as much on cultural convention as it does on physiological perception. As such, the misunderstandings surrounding evolution are largely implicated with the history of its imagery.
In this article, illustrations of evolution are selected from a range of historical periods and contexts. In one sense, they reflect the development of a scientific theory; in another, they show some of the visual structures that result from, and that persist as icons to contribute to people’s understanding of evolution. Ultimately, this article examines how a scientific image reflects the understanding of its creators, and how it creates understanding in its viewers.
Hierarchy, Order, and Classification
The concept of a Natural System—that there is an order to the diversity of life—has roots in the Classical and Medieval Western worlds (Lovejoy 1936). Figures such as The Chain of Being (Figure 1a) classify organisms into a hierarchy: basic forms such as fire, water, air, and earth serve as the foundation for increasingly complex organisms. The ladder ultimately culminates with humans and occasionally with God and his angels in the highest ranks (Figure 1b). The meanings here imbued in vertical graphic space are no incident of culture. Some argue that they are grounded in bodily experiences (Tversky, Kugelmass, and Winter 1991). An increase in height for example, is accompanied by increasing strength, or when piles of money or goods are involved, an increase in value. In language and gesture, people say things are looking up, they climb up the social ladder, they keep their chins up, they look to heaven above, and they give each other the thumbs up. In virtually all situations, up is associated with goodness, superiority, perfection, and the divine; and even as science has moved beyond the concept of a Chain of Being, the tendency for humans to place themselves in the favored place at the top of a system of classification is not a habit that has easily fallen away.
Such linear and hierarchical conceptions of the universe continued to influence diagrammatic representations of the Natural System for hundreds of years. Their influence is evident even among the Quinarians of the early nineteenth century (1819-1840), who recognized the insufficiency of a single chain to classify the observed diversity of life, and who instead described numerical relationships between animal groups in terms of affinities and analogies (O’Hara 1991; 1996). Diagrammatically, this concept took the form of an array of circles representing taxa. Points of contact between circles indicated affinities between those taxa, and dotted lines represented the analogies that could be drawn between them (Figure 2). The sense of continuity in the linking of circles and the symmetry of the composition suggest logic in the sequence and hint at a grander underlying design.
In opposition to the Quinarians, Strickland (1841) and Wallace (1856) developed a system of classification that depended solely on affinities between taxa. Species relatedness was conceptualized as circular or loop-like maps (Figure 3) that eventually shifted emphasis to a branch-like pattern (Figure 4). Since affinities between species rarely exist, Wallace reasoned, taxa were more appropriately placed at the ends of branches. The lengths of the branches would then represent the extinct taxa through which two groups were distantly related. Two years later, both Wallace and Darwin would propose the mechanism of natural selection whereby this pattern would occur (O'Hara 1988).
The Tree of Life
Most evolutionary trees prior to and including the single diagram in On the Origin of Species (Figure 5) were abstract, diagrammatic figures illustrating working hypotheses of the diversity of life on earth (Clark 2001). Lines that projected from single points illustrate species relationships through common ancestry and the trajectories of their diversification over time. In contrast to the linear Chain of Being and to the Quinarian system of classification by natural affinities, evolutionary trees demonstrated the genealogical branches that connect all organisms, both to each other and through the dimension of deep time. Their branches were more like bushes, and their arrangements more randomly dispersed. But the metaphor of a Tree of Life was very much present in language before the publication of On the Origin of Species, and the most memorable visual play on the term came from Ernst Haeckel, the 19th century German zoologist and Darwinist. In his book, The Evolution of Man, he illustrates a realistic depiction of a tree, with branches artificially arranged in a step-like fashion from single-celled organisms near the roots, escalating to where man finds his place at the summit (Figures. 6 and 7). The prominent central trunk suggests a single and inevitable path from primitiveness to complexity, and the abrupt branch endings mislead the viewer to believe that those most primitive organisms have failed to survive to the present. In its combination of time, hierarchy, and linear upward progression, this tree is closer in concept to Bonnett's Chain of Being than it is to Darwin's theory of descent with modification.
Yet, it is this image and variations on it (e.g., Figure 8), rather than the more complex diagrams used by scientists, that continued to be made available to the public well into the 1970s (Gould 1995). During the famous Scopes Trial of 1925, the sheer volume of news, books, presentations, and museum exhibits produced and consumed on evolution was especially high (Clark 2001). Through popularization, evolutionary theory and its representations became simplified to the point of distortion; and the scientific, political, and religious climates at the time contributed substantially to this process.
Linearity and Narration in Museums and the Media
In the scientific domain, while evolution was the espoused explanation for the diversity of life, the debate continued as to whether natural selection was indeed the mechanism by which it occurred (Clark 2001). At least with a more teleological explanation, scientists did not have to compromise their religious beliefs for their scientific views, and these leanings likely colored their communications with the public through the popular news media during the Scopes Trial. Moreover, at a time when not only a school teacher was on trial for violating the Tennessee anti-evolution statute, but so was education as a democratic right, the idea of social and racial equality, the role of science during World War I, and the question of individual free will, it is of no small consequence that those scientists most vocal were also the ones most eager to assure the public that evolution and fundamental Christian values could co-exist. Such debates continue today. As recently as 2005, the Dover Area School Board in Pennsylvania aroused parental anger when it required teachers to provide their students with “intelligent design” as an alternative scientific theory to that of evolution (BBC News, 2005). Besides a general misunderstanding of the nature of science driving such a decision, it would seem that subjective readings of illustrations might play critical roles in both past and present controversies over evolution.
One such widely circulated image that contributed to reinforcing public misconceptions of evolution is Huxley’s now iconic sequence of apes titled The Evolution of Man (Figure 9). First published as the frontispiece in his 1863 book, Man’s Place in Nature, the skeletons of a gibbon, an orangutan, a chimpanzee, a gorilla, and a man are seen evenly spaced in linear succession. In a variation of this composition, the cover of Gregory’s 1929 book, Our Face from Fish to Man (Figure 10) shows a diagonal sequence of faces that leads from that of a fish, to one identified in the book as a Tasmanian, and finally, to another identified as a Roman athlete. Illustrations such as Huxley’s and Gregory’s were presented to the public to demonstrate the fact of evolution (Clark 2001). As if to counter the ambiguity with which visual representations can sometimes be read, care is taken to present them as a reliable sources of evidence. The simple horizontal composition, for example, allows the image to be read less as a subjective piece of art, and more as an expository text. In this arrangement, figures might be replaced by nouns and their interactions with one another in space by verbs. With their neutral stances and averted eyes, or else with expressions that display no affect, they avoid any invitation to interact. The viewer is thus encouraged to gaze objectively upon them as specimens on display (Kress and van Leeuwen 2006). The juxtaposition of figures furthermore facilitates a systematic drawing of analogies. It allows the viewer to easily eliminate those characters that are consistent from one specimen to the next, and in the process, to readily see the relevant similarities and differences (Bastide 1990). In Huxley's image, for example, viewers would supposedly realize the similarities in morphology between humans and the apes, and become convinced that they share a common ancestor.
Difficulty in interpretation arises because there can be no direct literal translation from image to text. Both the graphic space and the context that displays the symbolic elements of an image hold meaning (Kress and van Leeuwen 2006). Moreover, the biases of the scientist, of the illustrator, and of the viewer inevitably influence both the rendering and the interpretation of the images. The decisions over what to prune in simplifying images for the public revealed the biases of the scientists, who naturally found it easier to view the story of evolution from an anthropocentric point of view, that is, as a sequence of events leading toward humans (Clark 2001). Thus, certain crucial features, such as the complexity of side branches were downplayed or eliminated altogether, while other features such as general trends and net directions were emphasized. In Huxley's illustration, for example, the equal distances between figures and their right-facing direction might erroneously suggest a smooth evolutionary transition from one to the next, rather than convey the complexity of relations that actually exists.
The resulting representations moreover reflect the social issues at stake in the debates over evolution. Just as Haeckel's placement of a human being at the top of the tree holds symbolic meaning, the position of the final face in the upper right corner of Gregory's illustration is telling of the issues of race and equality relevant at the time. The height of the face relative to the other animals is associated with superiority, and its position at the right suggests it as final statement, a goal, something new and improved following the old (Kress and van Leeuwen 2006). In this linear arrangement, not only are the organisms beginning the sequence hierarchically lower, as the tree representation implies, but in following the line from beginning to end, as one might read a sentence, the suggestion of primitiveness is all the more apparent (see also Figure 11).
The widely published diagram of horse evolution designed by Osborn in 1902 and displayed in the American Museum of Natural History in 1925 presents a similar problem (Figure 12). Here, the actual complexity of horse evolution is assumed given, although the linear composition that associates different anatomical forms of early horses with different geologic strata suggests a more straightforward and directed progression toward the present. Status in a museum exhibit and distribution in numerous publications no doubt lent it authority and an air of truth, not to mention prolonging its life under the public gaze (Clark 2001) (see also Figsures 13a and 13b)
Whether the viewer accepts an image as evidence is a separate issue, for competing with an illustration's persuasive devices are the viewers' prior beliefs. Scopes' prosecutor William Jennings Bryon, for example, famously objected to the diagrammatic depiction of humans in a tiny ring with the rest of the mammals (Clark 2001) (Figure14). His difficulty with the illustration from the textbook, Civic Biology, may stem from his inability to resolve it in the manner Elkins (1996) describes. According to Elkins, people have a need to resolve the images they see, to be held in sway until the message becomes clear. In most cases, this involves searching the image until meaning can be made from the constituent pieces; meaning that people instinctively and primarily seek in messages about themselves. Illustrations depicting evolution are thus like traps, for people cannot move beyond them until they have resolved the place of humans in the greater scheme; they cannot accept them until they are reassured that the message is consistent with their own conceptions. In this sense, Bryon sought in the image some confirmation of his personal notion of humankind's place above and apart from the lesser animals. But rather than enhancing or altering his beliefs, the illustration challenged them: it presented ideas that Bryon was unwilling to concede.
The Modern Tree of Life
Representations of the tree of life continue to change as new discoveries are made in genetics and molecular biology (Pennisi 1999). Consider contemporary trees of life generated by analysis of rRNA sequences (Figures 15-17). The strikingly organic circular shapes of the representations in figures 16 and 17 are likely consequences of fitting such vast information within limited graphic space, and the layout avoids the problematic concepts of linearity and hierarchy. Yet, the straightness of the lines, the tightness of the corners, and the exactness of the compositions recall an engineered world. Above all, this is a world constructed on rationality and numbers, and can thus be understood through rationality and numbers (Kress and van Leeuwen 2006). These modern trees of life stand in stark contrast to the simple progressions depicted by Huxley and Gregory. Side by side, they demonstrate the expansion of scientific knowledge of the natural world that occurred in the intervening decades. Yet, whether in their severity of line and composition these representations succeed in conveying what is known of species diversification today; whether they will overcome the simplified icons that persist from the ancient world; or whether they will create new, more ambiguous and potentially misleading ones, are empirical questions.
Contrast, for instance, Figures 15-17 with a simplified version of a phylogeny from an exhibit panel at the Field Museum of Chicago (Figure 18). Here, the curved lines that emanate from a common ancestor and gently diverge to pictorial representations of species are traces of Haeckel's tree and are very much of the natural world. It may be that people continue to cling to ideas of the divine; they may take comfort in believing there is yet a natural order underlying human existence and watched over by God.
The examples show how images can influence people's beliefs, and also how people's beliefs can influence the images produced. The result is a cyclical system of communication wherein both the image-maker and the image-receiver participate in image creation from knowledge, and knowledge creation from images. Further compounding people's current understanding of evolutionary thinking may be the iconic power of images: how those ancient philosophies of the natural system creep into contemporary representations and language, and influence scientific thinking. It may be that people never escape the metaphor of a tree of life, nor keep from conjuring that sequence from ape to man every time they hear the word evolution. Awareness of the implications is thus not only required of the viewer of the image, but also of the maker of the image.
References
Alters, B. J., and C. E. Nelson, 2002. Perspective: Teaching evolution in higher education. International Journal of Organic Evolution, 56(10): 1891-1901.
Bastide, F. 1990. The iconography of scientific texts: Principles and analysis. In Representation in Scientific Practice. Cambridge: The MIT Press.
BBC News. (2005). 'Intelligent design' teaching ban. Dover, PA. 2007.
Bonnett, C. 1745. The Chain of Being. In Traité d'Insectologie, premier parte. Paris: Durand.
Brumby, M. N. 1984. Misconceptions about the concept of natural selection by medical biology students. Science Education, 68(4): 493-504.
Clark, C. A. 2001. Evolution for John Doe: Pictures, the public, and the Scopes Trial debate. The Journal of American History. March 2001: 1275-1303.
Darwin, C. 1859. On the Origin of Species. J. Carroll, ed. 2003. Peterborough, ON: Broadview Texts.
Diamond, J, ed. 2006. The virus and the whale: Exploring Evolution in Creatures Small and Large. Arlington, VA: NSTA Press.
Elkins, J. 1996. The Object Stares Back: On the nature of seeing. New York: Harcourt, Inc.
Gould, S. J. 1995. Ladders and cones: Constraining evolution by canonical icons. In R. B. Silvers, ed., Hidden histories of science. New York: New York Review of Books.
Green, D. and R. Shapley. 2005. Teaching with a visual tree of life. School of Information Management and Systems, University of California Berkeley.
Gregory, W. K. 1929. Our face from fish to man: A Portrait gallery of our ancient ancestors and kinsfolk together with a concise history of our best features. New York: G. P. Putnam’s Sons.
Gruenberg, B. C. 1929. The story of evolution: Facts and theories on the development of life. Garden City, New York: D. Van Nostrand Company, Inc.
Haeckel, E. (1906). The evolution of man: A popular scientific study. London: Watts.
Hunter, G. W. 1914. A Civic Biology Presented in Problems, New York: American Book Co.
Huxley, T. H. 1863. Man's place in nature. New York: D. Appleton and Company.
Kress, G. and T. van Leeuwen. 2006. Reading images: The grammar of visual design. New York: Routledge.
Lovejoy, A. O. 1936. The great chain of being: A Study of the history of an idea. Cambridge: Harvard University Press.
Lynch, M. 1990. The externalized retina: Selection and mathematization in the visual documentation of objects in the life sciences. In S.W. M. Lynch, ed., Representation in Scientific Practice (pp.153-186). Cambridge, MA: The MIT Press.
Pennisi, E. 1999. Is it time to uproot the tree of life? Science, 284: 1305-1310.
Novick, L. R., and K. M. Catley. 2000. Spatial diagrams: Key instruments in the toolbox for thought. In D. L. Medin, ed., The Psychology of Learning and Motivation (Vol. 40, pp. 279-322). London: Academic Press.
National Science Education Standards. 2007. Chapter 6: Science content standards. http://www.nap.edu/readingroom/books/nses/6a.html (accessed May 23, 2007).
O’Hara, R. J. 1988. Diagrammatic classification of birds, 1819-1901: Views of the natural system in 19th century British ornithology. In Acta XIX Congressus Internationalis Ornithologici, H. Ouellet, ed. Ottawa: National Museum of Natural Sciences.
O'Hara, R. J. 1996. Trees of history in systematics and philology. In Systematic Biology as an Historical Science (Vol. 1, pp. 81-88): Memorie della Società Italiana di Scienze Naturali e del Museo Civico di Storia Naturale di Milano.
O'Hara, R. J. 1991. Representations of the natural system in the nineteenth century, Biology and Philosophy 6: 255-274.
Strickland, H. E. 1841. On the true method of discovering the natural system in zoology and botany. Annual Magazine of Natural History, 6: 184-194.
Swainson, W. 1836-1837. On the natural history and classification of birds. 2 vols. London: Longman, Rees, Orme, Brown, Green, and Longman.
Tversky, B., S. Kugelmass, and A. Winter. 1991. Cross-cultural and developmental trends in graphic productions. Cognitive Psychology, 23: 515-557.
Wallace, A. R. 1856. Attempts at a natural arrangement of birds. Annual Magazine of Natural History, 18: 193-216.
Acknowledgement
I would like to thank Dr. Robert Hariman (Northwestern University) and the students of the Spring 2007 Communication Studies 525 class in Visual Rhetoric for their insights and opinions. I would also like to thank the participants of the Nebraska Evolution Challenges Meeting 2007 for their enlightening discussions: Judy Diamond (University of Nebraska-Lincoln), Amy Spiegel (University of Nebraska-Lincoln), Margaret Evans (University of Michigan), Sarah Brem (Arizona State University), David Uttal (Northwestern University), Anastasia Thanukos (UC Berkeley), Larry Scharmann (Kansas State University), Jeannine Turner (Florida State University), and Josephine Kurdziel (University of Michigan)
Author
Camillia Matuk has a B.Sc. in Biological Sciences from the University of Windsor, and a M.Sc. in Biomedical Communications from the University of Toronto. Before returning to school for a PhD in Learning Sciences at Northwestern University, she worked as a medical illustrator at InViVo Communications, Inc. Currently, her research interests are in public understanding of science from visual representations in natural history museums, and in the link between drawing, cognition, and creativity. Contact her at camillia.matuk@gmail.com.
|