 |
||||
| Calendar & News | Columns | Features | Gallery | Showcase |
|
|
|||||||||||||
|
|||||||||||||
The Iconic Pain Assessment Tool: Facilitating the Translation of Pain Sensations and Improving Patient-Physician Dialogue |
Emilie McMahon, Linda Wilson-Pauwels, James Henry, Jodie Jenkinson, Brian Sutherland, Meaghan Brierley A novel Iconic Pain Assessment Tool (IPAT) was created based on published literature on the visualization of pain and on feedback from patients who have Central Post-Stroke Pain (CPSP). Using visual pain icons and an intuitive online interface, patients can record multiple facets of their pain, including its quality, intensity, location on the body, and shifting throughout the day. By improving dialogue and the translation of pain sensations from the
patient to the physician, the IPAT has the potential to speed up accurate
diagnosis and improve pain management for patients including those with
limited cognitive or verbal abilities.
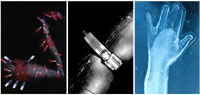 Figure 2. Photomontages of pain as described by patients with long-term chronic pain from, Padfield, D. 2003. Perceptions of Pain. Stockport: Dewi Lewis Publishing.
|
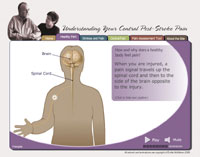
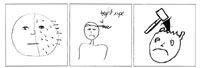
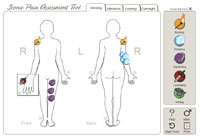
Introduction The overwhelming majority of patients visit their physician because of one particular symptom: pain (Nagda and Bajwa 2004; Hurwitz 2003). However, because of its highly subjective nature, pain is also one of the most challenging concepts to communicate. Using visuals to describe pain could make its assessment and management more accurate and could also help bridge communication between a physician and a patient. Pain assessment and management are especially important for people who suffer from chronic pain conditions such as neurogenic pain. Some examples include central pain, fibromyalgia, complex regional pain syndrome, sciatica, phantom limb pain and multiple sclerosis. A proper diagnosis of the pain condition cannot be made without an adequate understanding by the physician of the pain sensation, quality, location, duration, and intensity. Unfortunately, the indistinguishable properties of pain make its recounting challenging for a patient and even more so when the patient has memory problems, sensory disabilities, or verbal communication difficulties. We explored the topic of visualizing pain through the creation of a web-based educational module targeted towards patients who have a condition called Central Post-Stroke Pain (CPSP). This condition develops in people who have suffered a stroke and manifests itself in extremely painful sensations throughout the body. In many cases, pain develops months and sometimes years after a stroke, at which time the patient is no longer under intense medical scrutiny. The pain, therefore, is not always immediately linked to the stroke. Many strokes involve larger areas of the brain than just the sensory thalamus, further complicating diagnosis. Once properly diagnosed by a physician, only a small number of patients find a successful pharmaceutical or surgical treatment for their symptoms (Hansson 2004; Nicholson 2004) and most patients live with chronic pain from their condition. Our original research concept was to address the needs of those who are often disoriented due to a stroke, and the proposed visual communication tool was intended to help these patients understand their pain and how it developed. Since there are no visible signs of pain, the visual communication tool was also designed to help patients explain their pain to family and health-care professionals. Finally, a stroke often damages the speech area of the brain, so the tool could provide a non-verbal means for describing pain. To help address the need for CPSP patients to understand their pain and communicate it, a web-based module was created. The module, which contains two main sections, is available at http://www.emiliemcmahon.ca/mrp.html. The purpose of the first section of the module was to educate patients and their families about CPSP through two-dimensional Flash animations (Figure 1). The animations help patients understand how their stroke is linked to their pain and why their pain is so intense. English and French narrations and text-captions are included, making the information accessible to a wider audience. The second section of the module includes an Iconic Pain Assessment Tool (IPAT), which affords patients the opportunity to communicate through visual icons, the location, type, and intensity of their pain, as well as the time of day that their pain occurs. This article focuses on the IPAT, its development and its future applications. Visual Media and Pain Assessment Since stroke lesions in the nervous system are often too small to detect through medical imagery, a physician must rely on a patient’s self-report of his or her symptoms (Wittink et al. 2004; Bird 2005) and then translate the report into terms that are clinically relevant. With the existing tools, misinterpretation and miscommunication of symptoms can occur, which can lead to improper diagnosis and mismanagement of pain (Kenny 2004; Kimberlin et al. 2004). For the most part, pain assessment tools used by physicians to diagnose and manage chronic pain conditions are largely text-based, and are therefore subject to native-language and language-level barriers. The existing iconic visualizations of pain sensation are generally in the form of diffuse red circles, bull’s eyes and lightning bolts. Such iconic visual communication has proven successful in facilitating communication (Beardon 1995) and has been used to eliminate natural language barriers existing, for example, in patients presenting with aphasia (Kagan et al. 1996). However, despite the successful use of icons in other medical areas, the progression of text-based pain assessment to visual and interactive pain assessment does not seem to have been adopted by clinicians (Jamison et al. 2004). Furthermore, the existing assessment tools do not adequately convey the vivid and often visual descriptions of pain described by CPSP patients. One account of central pain from the literature dates back to 1911 (Head and Holmes): it was felt “as a crushed feeling, as a scalding sensation, as if the leg was bursting, as something crawling under the skin, as if a log was hanging down from the shoulder.” In a published testimonial, Reiter (2004) described her CPSP as “an extreme sunburn” and “a tight-muscle feeling as if I were flexing my muscles on purpose.” The photographer Deborah Padfield (2003) worked with chronic pain sufferers to enable them to visualize their pain using conventional film, collages, and darkroom techniques (Figure 2). She explored the use of this visual language to enable others, including physicians, to see, feel and comprehend their pain, therefore providing a possible treatment for the psychological dimension of their suffering. In her book, patients reported using Padfield’s exercise as an emotional outlet for their pain. Physicians who viewed the images said they now had a better understanding of the severity and complexity of chronic pain sensations. With regard to phantom limb pain, visual representation of the absent limb, either through the use of digital photography manipulation or by using a mirror or even virtual reality to project an image where the limb should be, has been successful in lessening the pain felt by patients (Halligan et al. 1999; MacLachlan et al. 2004; Murray et al. 2006). In the field of pediatric pain, the limited verbal abilities of children make conventional text-based pain assessment methods less appropriate (Unruh et al. 1983). There has been some research on the usefulness of children’s drawings for diagnosing pain conditions. In a few instances, children have been asked to draw their pain or draw themselves in pain instead of verbally describing to their physician how they feel (Stefanatou and Bowler 1997; Unruh et al. 1983). In 2002, Stafstrom et al. were able to successfully distinguish migraine headaches from tension-type headaches based on a comparison of the drawings produced by each child (Figure 3). Many other patient populations have reported on the limitations of text-based pain assessment tools. These include aphasic patients, those with cognitive disabilities, patients with limited verbal language capabilities, or those from different ethnic and cultural backgrounds (Herr et al. 2006; Bird 2005; Boldingh et al. 2004). We hypothesized, based on current text-based pain assessment tools, that a visual assessment tool could be designed to help break down the verbal language barrier that exists between patients with CPSP and their physicians. While proving to be a more efficient way for patients to accurately communicate their symptoms, this tool could have the potential to improve the management and treatment of pain. Development of the Iconic Pain Assessment Tool (IPAT) The goal of the IPAT is to provide a patient with an interactive tool to communicate pain. The user begins by selecting either a male or female figure template and then chooses from a menu of visual pain icons that represent different types of pain. By dragging an icon, or clicking on it, the patient positions the icon on the part of the body where the pain is occurring. The user can also tab between different times of the day (morning, afternoon, evening, and overnight) to differentiate shifts in pain. When the user has finished mapping the pain throughout the body, a printout can be generated. These printed visual depictions of daily pain can be shared with family and friends. More importantly, the patient can take the printout to the physician’s office to serve as an important starting point for discussion as well as a tool to track and compare pain over a period of time. The development of the IPAT began with the design of the icons representative of the most common types of pain sensations identified by people who have CPSP. Five pain qualities were chosen based on their prevalence in the literature (Andersen et al. 1995; Cohen and Abdi 2002; Widar et al. 2002): burning, freezing, squeezing, lacerating and aching. The creation of the visual metaphor associated with each sensation was based largely on an image search of each of the five different pain qualities and their synonyms. Resources included the Internet, magazines, television commercials, and comic book depictions of pain. Figure 4 illustrates the metaphors that were included in the final project: a flame on a matchstick for burning pain, an ice cube for freezing pain, a vice for squeezing pain, a knife for lacerating pain, and an anvil for aching pain. A zoom feature for the hands and feet gives patients the option of placing icons on a single digit. Since the target population was estimated to range between 65-80 years of age based on stroke statistics (American Heart Association 2005), we decided the user should be given an alternative to the popular “drag and drop” feature present in most interactive programs. The user has the option of first clicking on an icon to select it and then clicking on the body part with which the pain icon is to be associated. The IPAT attempts to address multiple dimensions of pain, including quality, intensity, location, and type. In pain assessment there is an important distinction between “pain quality” and “pain intensity” (Holroyd et al. 1996). Pain quality is the sensory dimension of pain and is addressed in this tool by the five visual icons representing different types of pain. The intensity of pain is measured on a scale from low to high intensity regardless of the type of pain. To address the issue of pain intensity while at the same time limiting the complexity, the program was designed to allow either placement of a single icon (low intensity pain) or multiple icons in the same area of the body (high intensity pain). Patient Feedback Even though substantial effort was directed toward the recruitment of patients, under-diagnosis of CPSP and the isolating nature of this illness made access to a large number of participants extremely difficult. During the development of the IPAT, a needs assessment questionnaire was distributed to six patients diagnosed with CPSP. Only two patients responded to the questionnaire. However, they provided valuable written/verbal descriptors of what their pain sensations felt like and how well they understood the cause of their pain. They described their pain using metaphors such as “the pressure in my foot feels like something is pushing” and “it feels like my arm is immersed in freezing cold water.” Once the feedback was incorporated, one patient continued to evaluate the tool. The patient’s response to the IPAT was quite positive and he was able to map his pain onto the body outline without difficulty. The patient indicated that he would definitely refer to the website in the future and would like to show the tool to his family and friends and health-care professionals with whom he was involved. The limited feedback that was received was an important first step in the evaluation of the IPAT and proved to be valuable to the project. Conclusion The novel interactive IPAT has the potential to be a valuable addition to pain assessment tools currently used in clinical settings, especially since existing tools are text-based and tend to exclude patients with limited cognitive or verbal abilities. The IPAT provides a common ground for effective patient-physician communication. Since patient input is crucial to understanding and diagnosing chronic pain, improving dialogue and the translation of pain sensations from the patient to the physician may speed up accurate diagnosis and improve pain management. Indications for further research While the IPAT was designed originally for people who suffer from CPSP, we expect that the tool could have much broader application. To accomplish this, steps are underway to begin testing the IPAT in a clinical setting, under controlled circumstances, and with a more significant number of patients than was undertaken as part of the initial project development. We will be looking at patient satisfaction and the statistical success rates of clinicians’ diagnosis of the symptoms. Some anticipated changes to the existing IPAT include: expanding the library of pain icons; personalizing a login for each patient; tracking pain over days and months; tracking pain under various conditions (hot/cold, indoor/outdoor, with/without medication, during daily activities); and the addition of a drawing tool or text-input boxes for describing pain not identified by the IPAT icons. The incorporation of a Visual Analogue Scale (VAS), (Price et. al. 1983), a widely used measurement of pain intensity on a scale of one to ten, would provide a familiar reference point and encourage greater acceptance of the IPAT amongst the clinical community. Beyond the direct benefit to the patient, the IPAT is expected to find extensive applicability among health-care professionals. It can be used in initial and follow-up clinical assessment. Given that the tool uniquely monitors pain intensity and quality at four different times of the day, it can potentially track diurnal variation in the pain. As well, the IPAT might be helpful in monitoring the development and severity of the pain over weeks and months, a feature not currently available through standard pain assessment methods. Attending health-care professionals might also find the IPAT helpful in monitoring the efficacy of treatments and clinical interventions. Beyond the health-care community, it is anticipated that the IPAT could provide industry with a unique means of measuring the efficacy of new drugs under development in clinical trials. Overall, we anticipate that eventually this pain assessment tool could achieve widespread application from patient, to family, to general practitioner, to specialist, to industry, providing these communities with a new standard of pain assessment. Acknowledgements Ammar A. Gilani, MD Sharon Nancekivell, BA, BEd, MA Margot Mackay, ANSCA, BScAAM Funding: Canadian Institutes for Health Research (CIHR) Strategic Training Program on Pain: Molecules to Community Student Fellowship References American Heart Association. 2005. Heart disease and stroke statistics – 2005 update. Dallas: American Heart Association. Andersen, G., K. Vestergaard, M. Ingeman-Nielsen, and T.S. Jensen. 1995. Incidence of central post-stroke pain. Pain 61: 187-93. Beardon, C. 1995. Discourse structures in iconic communication. Artificial Intelligence Review 9 (2 3): 189-203. Bird, J. 2005. Assessing pain in older people. Nursing Standard 19 (19): 45-52. Boldingh, E.J., M.A. Jacobs-van der Bruggen, G.J. Lankhorst, L.M. Bouter. 2004. Assessing pain in patients with severe cerebral palsy: Development, reliability, and validity of a pain assessment instrument for cerebral palsy. Archives of Physical Medicine and Rehabilitation. 85: 758-766. Cohen, S., and S. Abdi. 2002. Central pain. Current Opinion in Anesthesiology 15: 575-581. Halligan, P.W., A. Zeman, and A. Berger. 1999. Phantoms in the brain. British Medical Journal. 319: 587 588. Hansson, P. 2004. Post-stroke pain case study: clinical characteristics, therapeutic options and long-term follow-up. European Journal of Neurology 11 (Suppl. 1):22-30. Head, H. and G. Holmes. 1911. Sensory disturbances from cerebral lesions. Brain 34: 102-254. Herr, K., P.J. Coyne, T. Key, R. Manworren, M. McCaffery, S. Merkel, J. Pelosi-Kelly and L. Wild. 2006. Pain assessment in the non-verbal patient: Position statement with clinical practice recommendations. Pain Management Nursing 7 (2): 44-52. Holroyd, K.A., F. Talbot, J.E. Holm, J.D. Pingel, A.E. Lake, and J.R. Saper. 1996. Assessing the dimensions of pain: A multitrait-multimethod evaluation of seven measures. Pain 67: 259-265. Hurwitz, B. 2003. Looking at pain. In: Padfield, D. Perceptions of Pain. Stockport, UK: Dewi Lewis Publishing. pp. 7-13. Jamison, R.N., G.J. Fanciullo and J.C. Baird. 2004. Computerized dynamic assessment of pain: Comparison of chronic pain patients and healthy controls. Pain Medicine 5 (2): 168-177. Kagan, A., J. Winckel and E. Shumway. 1996. Pictographic communication resource: Enhancing communicative access. North York: Aphasia Centre. Kenny, D.T. 2004. Constructions of chronic pain in doctor-patient relationships: bridging the communication chasm. Patient Education and Counseling 52: 297-305. Kimberlin, C., D. Brushwood, W. Allen, E. Radson and D. Wilson. 2004. Cancer patient and caregiver experiences: Communication and pain management issues. Journal of Pain and Symptom Management 28 (6): 566-578. MacLachlan, M., D. McDonald, and J. Waloch. 2004. Mirror treatment of lower limb phantom pain: A case study. Disability and Rehabilitation. 26: 901-904. Murray, C.D., E.L. Patchick, F. Caillette, T. Howard, S. Pettifer. 2006. Can immersive virtual reality reduce phantom limb pain? Studies in Health Technology and Informatics. 119: 407-412. Nagda, J., and Z.H. Bajwa. 2004. Definitions and classification of pain. In Principles & practice of pain medicine, ed. C. A. Warfield and Z. H. Bajwa. New York: McGraw-Hill Companies. Nicholson, B. D. 2004. Evaluation and treatment of central pain syndromes. Neurology 62 (90052): 30S 36. Padfield, D. 2003. Perceptions of Pain. Stockport: Dewi Lewis Publishing. Price, P. D., P.A. McGrath, R. Amir, B. Buckingham. 1983. The validation of visual analogue scales as ratio scale measures for chronic and experimental pain. Pain 17 (1):45-56. Reiter, E. 2004. Personal accounts: a truly invisible handicap. Psychiatric Services 55 (4): 363-364. Stafstrom, C.E., K. Rostasy and A. Minster. 2002. The usefulness of children’s drawings in the diagnosis of headache. Pediatrics 109 (3): 460-472. Stefanatou, A. and D. Bowler. 1997. Depiction of pain in the self-drawings of children with sickle cell disease. Child: Care, health and development 23 (2): 135-155. Unruh, A., P. McGrath, S.J. Cunningham and P. Humphreys. 1983. Children’s drawings of their pain. Pain 17: 385-392. Widar, M., L. Samuelsson, T. Karlsson, and G. Ahlstrom. 2002. Long-term pain conditions after a stroke. Journal of Rehabilitation Medicine 34:165-170. Wittink, H., L.C. Goudas, S. Strassels, and D.B. Carr. 2004. Outcome measurements in pain medicine. In Principles & Practice of Pain Medicine, ed. C. A. Warfield and Z. H. Bajwa. New York: McGraw-Hill.
Émilie McMahon, BSc, MScBMC is currently working with the Ontario Telemedicine Network as a Bilingual Trainer, developing static and e-training modules. Prior to that, she worked as a Medical Illustrator at QA International, a division of Québec Amérique. She developed the Iconic Pain Assessment Tool and educational animations as part of her Master’s Research Project completed for her Master’s of Science in Biomedical Communications (MScBMC), Institute of Medical Science, University of Toronto. Prior to entering the program, she completed a Bachelor of Science degree in Biomedical Sciences at the University of Guelph. Her interests include knowledge translation for patient education and interactive media. emiliemcmahon@yahoo.ca Linda Wilson-Pauwels, AOCA, BScAAM, MEd, EdD is a tenured Professor in Biomedical Communications (BMC), Institute of Communication and Culture (ICC), University of Toronto Mississauga (UTM). She is cross-appointed to the U of T Department of Surgery, Centre for the Study of Pain and The Wilson Centre for Research in Education. She is a visual communicator with advanced degrees in higher education. Her interest is in information transfer to target audiences, development of visual organizational tools, and visual cues and their role in directing attention. James Henry, PhD is Scientific Director of the Michael G. DeGroote Institute for Pain Research and Care at McMaster University in Hamilton, Ontario. He is a neurophysiologist working on pain mechanisms, particularly the chemical basis of synaptic transmission in spinal pain pathways and changes in primary sensory neurons in animal models of chronic pain. Animal models developed include those for central post-stroke pain, peripheral neuropathic pain, bone cancer pain, the pain of osteoarthritis and rheumatoid arthritis, temporomandibular joint dysfunction, acute bowel inflammation and acute skin inflammation. He is also leading a nation-wide initiative in knowledge translation on pain. Jodie Jenkinson, BA, MScBMC is an Assistant Professor specializing in instructional design in BMC in the ICC at UTM. She is the author and designer of The Prostate Centre, a CD-ROM and Web site and co-author of the BreastMatters Web site, both educational programs designed for patients of The University Health Network in Toronto. Jenkinson has a cross-appointment to the Department of Surgery. Her research is in interface design and data visualization. Brian Sutherland, BA, MEd has been involved in educating teachers, new media students and web application developers at a number of institutions over the past 15 years. More recently Brian was an IT architect for the Province's educational repository “e-learning Ontario” and he now serves as the Instructional Technology Coordinator for the University of Toronto Scarborough, as well as a Lecturer in Biomedical Communications. Meaghan Brierley, BFA, MScBMC is a Lecturer in BMC in the ICC at UTM, and works for the Division of Academic Computing, Faculty of Medicine, University of Toronto. She collaborates on the development of websites, web applications and learning objects, and is interested in visual media as a persuasive element of these products. |
Copyright
2008, The Journal of Biocommunication, All Rights Reserved
Table
of Contents for VOLUME 34, NUMBER 2