 |
||||
Illustrating Artifacts Using Digital Rendering Techniques |
Marc Dryer and David Mazierski Creating illustrations of archaeological artifacts for scientific publication requires the illustrator to use special established conventions. This paper describes a method of illustrating flaked lithic artifacts that utilizes a combination of traditional and digital rendering techniques. The method involves tracing a digital photograph of the artifact using a vector-based graphics program in order to create a highly accurate line drawing of the tools silhouette profile and flake scar borders. The details of texture, shading and flake scar ripples are added with pen and ink, or through a continuation of the digital vector technique. This approach allows professional illustrators, researchers, and students of archaeology to create competent scientific illustrations in conformity with the conventions for this specialized discipline.
|
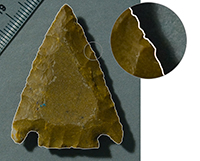
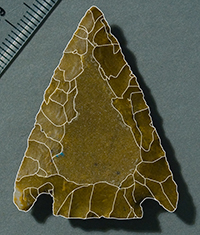
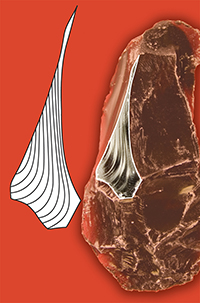
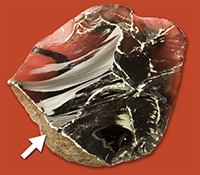
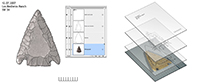
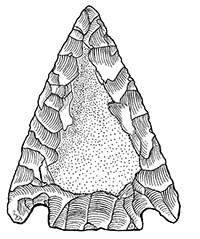
Introduction The earliest stone tools (lithic artifacts) in the archaeological record are dated to approximately 2.6 Ma (Toth and Schick 2007). Since that time lithic technology has formed, and in some cases continues to form, an important part of material culture in many societies throughout the world. The spatial and temporal ubiquity of these items, combined with their natural resistance to decay, has made the study of stone tools a crucially important part of archaeological research. Lithic artifacts vary widely in terms of style, function, material, and mode of manufacture. Flaked lithics, created through the application of localized percussive force or pressure (Andrefskey 2005), describe a large subsection of this group. Discipline-specific techniques for the illustration of stone tools have been developed to document this important evidence. Artifact illustration is an important component of the published scholarly discourse that documents and defines the study of archaeology itself (Piggott 1965, 1978). As a descriptive element, an illustrations key role is to provide a suitably accurate substitute for the object it portrays, thereby allowing viewers to conceive of, and draw comparisons to, an object to which they have limited or no access. However, because an illustration is a product of informed interpretation (those elements deemed important are given emphasis while those of no interest are excluded) such comparisons are possible only if each illustration is drawn according to a set of established conventional practices. By providing dependable rules that act to standardize illustrations, these conventions allow the viewer to interpret an image with greater ease than an image that does not adhere to this visual grammar. Consistent application of these rules increases the legibility of an individual illustration and facilitates comparisons between images from one or more sources. The conventions observed in lithic artifact illustration include the use of common figurative elements, such as a scale bar and symbols indicating key features (Addington 1986; Martingell and Saville 1996), standard lighting in which the specimen is presented as if it were lit from the upper left (Jessup and Mascaro 2003), the consistent orientation of the specimen on the page (Addington 1986; Andrefsky 2005), and the use of line and/or stipple in the final rendering. Despite the direction offered by the conventions of scientific illustration, the artist must decide how to execute the drawing in order to translate the experience of viewing a physical object into an accurate two-dimensional representation. The practical considerations involved in this process comprise what can be called the approach to the illustration. There are many ways to approach an illustration while still adhering to the standard set of conventions, and there are a number of published guides to stone tool illustration; each recommends different approaches to the various stages of the recording and rendering process (eg. Addington 1986; Adkins 1989; Corsiglia and Rosen, 1981; Griffiths 1990; Jastrzebski 1985; Martingell and Saville 1988). Generally speaking, the process can be divided into three stages: establishing the silhouette profile (boundary of the outer edge) (Figure 1); drafting the internal flake scar borders (Figure 2); and adding details of texture (flake scar ripples and unmodified cortex) (Figures 3 and 4). Rendering Stages Silhouette profile The first step in flaked lithic artifact illustration is to record and render the outline of the object from one of the primary views (dorsal, ventral or profile). The outline dimensions can be captured and drawn in a number of ways, which include the use of a camera lucida, the use of a reference grid, direct tracing, and a photo-drawing technique. Camera lucida The camera lucida is a device that, through the refractive qualities of a triangular prism, allows the artist to view both the object to be portrayed and the drawing surface simultaneously while optically superimposing the former onto the latter. With the view of the object projected onto the page, this image can then be physically traced (Jastrzebski 1985: 289). The size of the image, thus the drawing, can be controlled by the relative distance of the prism from the paper (a greater distance will result in a larger image). Grid Drawing A simple and efficient method for accurately illustrating an object involves the use of a local coordinate system through which the object is viewed. A regular grid on a sheet of transparent acetate or glass is placed between the object and the viewer; this surface can then be drawn on directly, or it can serve as a reference for a drawing executed on paper that has a matching grid. In this technique the illustration is reduced to many small units that correspond to the imposed coordinate system. Rendering each small piece with reference to the grid minimizes errors of proportion and detail that are difficult to avoid without appeal to an imposed system of arbitrary coordinates. This method is also useful for enlarging an image through the use of a drawing grid which is uniformly increased in scale relative to the viewing grid. Direct tracing Many sources recommend that the illustrator place the artifact directly onto the page and trace a line around its circumference (Adkins 1989; Corsiglia and Rosen 1981; Griffiths 1990; Martingell and Saville 1988). Using a sharp pencil held exactly perpendicular to the page while looking directly down at the object with one eye shut, it is possible to capture the outline of the artifact. For deep specimens with edges that are too far from the page, a set-square can be used to mark profile points that can then be connected on the paper. While this approach is appealing because of the clear relationship between object and image, it has many limitations that diminish its appeal: the image must be drawn at a 1:1 scale, the direct contact could damage a fragile piece, and any deviation from holding the pencil at 90 degrees from the drawing surface will result in errors of recording. Using a tapered pencil can also result in a slightly inflated outline because of the small lateral distance between the pencil tip and the point on the shaft in contact with the artifact. Addington also suggests that this quick method is prone to error (1986: 54). To mitigate these problems Adkins (1989) recommends validating the outline and internal features through metric analysis. Photo-drawing Sterud and Bohlin (1976) describe an approach in which the artifact is photographed, and the outline of the portrayed object is traced directly onto the developed photograph using India ink. The photograph is then submerged into a bleach bath that removes the image but leaves the India ink line-work on a field of white. This photo-drawing technique is also described in Jastrzebskis practical overview of scientific illustration (1985: 284). Enlarging an illustration can be achieved by enlarging the photograph during development. Internal Features Once the external outline is established the internal flake scar borders must be identified and rendered. While Adkins (1989) and Jastrebski (1985) recommend a continuation of the grid or camera lucida techniques mentioned above, other authors suggest that the features can be recorded using the methods described below. Offset and Observation With this technique the illustrator places the artifact on the drawing paper, immediately next to the rendered silhouette profile. Through careful observation of the internal features close to the periphery, the flake scar borders can be drawn from the outside-in (Addington 1986; Martingell and Saville 1988). This technique becomes more difficult as one attempts to draw features distant from the external outline. For major internal features, like a prominent confluence of border edges, Addington (1986) recommends that the illustrator draw horizontal and vertical axes below and beside the object. Horizontal and vertical guides are then projected from the landmark to intersect with these axes. By drawing a matching coordinate system on the paper, these two points of intersection can be measured and used to locate the internal feature on the page. Feature triangulation Griffiths (1989) suggests a similar technique in which measurements are made between each major internal feature and two well-defined points on the objects silhouette profile. With the aid of a compass, these two measurements can then be used to triangulate and plot the position of the internal feature in the drawing. Pencil drop Adkins (1989) describes the pencil drop technique, in which the artifact is centered on the drawing and the pencil is held directly over an internal feature. The specimen is then moved laterally, and the pencil drops to the paper to mark the features location. These points are then joined and the borders refined through direct reference to the object. While expedient, this method seems likely to produce inaccuracy in recording. Details of texture Once the outline and flake scar borders have been established and rendered, the final step is to add details of texture and shading. Typically, unmodified cortex is rendered in stipple, and the flake scar ripple marks are rendered in line. In both cases, by varying density of the lines or stipple marks it is possible to produce the impression of tonal variation and thereby shade the object in order to communicate the local form of the individual flake scars and the shape of the piece as a whole. In addition to shading, the ripple marks within the scars indicate the direction of force applied at the time of flake removal. The quality of the lines also speaks of the nature of the material: a broken or jagged line will indicate a more granular or weathered material, while a continuous line speaks of a more crystalline, glass-like structure in pristine condition (Martingell and Saville 1988). This stage is not one of tracing but rather of careful observation, informed interpretation and illustration. On this point, all of the previously mentioned guides agree. What is left to the illustrators discretion is the media used to complete the rendering: technical pen, split nib pen, or digital rendering tools. Each of the methods described above has its own benefits and weaknesses, usually with compromises being made between expediency and accuracy. Digital vector rendering for flaked lithic artifact illustration A new approach to flaked lithic artifact illustration that is both highly accurate and accessible utilizes digital photography and vector-based digital graphics software. This new method does not suggest any change to the typical appearance of such an illustration, or any change to the conventions that guide the illustrator, but simply provides an alternative approach that draws on the strengths of accessible technology. As mentioned above, Sterud and Bohlin (1976) describe a technique for rendering the silhouette outline and flake scar borders by drawing directly onto a photograph of the artifact. The use of digital technology affords the opportunity to update that technique, and make it more convenient and versatile. Vector-based illustration can emulate the look of a traditional pen and ink illustration but allows for easier editing. In addition, the softwares layer-based illustration structure facilitates the process of tracing the photograph. This digital method also involves three stages: photography; vector tracing the silhouette profiles and internal flake scar borders; and adding details of texture and surface quality. Step 1: Photographing the artifact Many of the techniques mentioned above call for the illustrator to view the object with only one eye (grid method, pencil drop, direct tracing, camera lucida). The distance between the eyes aids in the perception of three-dimensional form, but is problematic when attempting to reduce this form to a two-dimensional representation, as each eye perceives the object from a slightly different position. A lack of consistency in the view used when tracing can result in errors of recording. By photographing the artifact, the camera acts as a monocular mechanical intermediary that eliminates this problem. The use of a mechanical device, however, does not ensure objectivity in recording (Van Reybrouck 1998), and care must be taken when arranging the camera and specimen. The stone tool should be placed on a non-reflective background such as a felt cloth, and held in place by positioning it on a small ball of a pliable modeling material. The backdrop color should provide an adequate hue and value contrast to the material of the artifact. This will make it easier to determine and plot the true profile edge of the tool from the resulting photograph. The camera should be mounted on a tripod looking down at the tool, and in order to avoid lens distortion in the image, it is best to maximize the distance between the camera and the subject. This distance is determined by setting the cameras lens to its maximum focal length (zoomed-in), and then physically moving the camera up or down to ensure that the artifact fills the camera view. Therefore, it is best to use as long a lens as is possible. Photos taken with a telephoto lens tend to flatten the representation of the object, resulting in an image that approaches an orthographic view. Positioning the camera too close to the subject and using a wide-angle (more highly curved) lens results in a rectilinear, or in the case of extreme close-up, curvilinear distortion in which central features of the specimen appear inflated while those on the periphery are visually diminished. Lighting for photography Although the specimen must be rendered and shaded in a way to indicate a light source from the upper left, it is useful to take a multiple photographs, varying the direction of lighting in each. Many features will not be visible for tracing under the upper left light source, but will be revealed under different lighting conditions. Both the camera and object position should remain fixed if multiple photographs are being taken: by moving only the light source, the photographs can be easily registered to one another at the time of tracing. For specimens with highly reflective surfaces, such as obsidian, the specular highlights may occlude much of the surface detail. To reduce this problem, the tool can be coated with a removable matte finish (Lutz and Slaby 1971; Prokop 1985; Rovner 1974), or a stick of chalk can be drawn over the surface to highlight the raised flake scar borders (Addington 1986). At all times, the best solution for resolving unclear areas in the photographs is constant reference to, and careful observation of, the actual object. Photographs should be taken at as high a resolution as possible so small areas of the photograph can be magnified on the computer to facilitate tracing and capturing minute details. After transfer to a computer, the images should be saved in an uncompressed format. Step 2 -Tracing the silhouette profile and internal flake scar borders The greatest challenge at this stage is to understand how digital vectors are constructed and how to create and manipulate them. What follows is a description of vector art and the digital vector tracing procedure. While some detail is included, a complete overview of vector-based software is not possible, and those following this guide should familiarize themselves with the interface and tools of their particular software. Digital vector art defined There are two types of digital images: raster graphics, and vector graphics. Raster graphics use pixels as the basic unit of graphic information, where each pixel represents a unique sample of the image color, value, and transparency at a specific location. Pixels are arranged in a grid, or bitmap, and together form a representation of the image. A common example of a raster file is a digital photograph. The number of pixels that are used to represent an image, referred to as pixels per inch (ppi), defines the resolution of the image. There is no correct level of resolution for any image; rather the appropriate resolution is contextually determined by its intended use and output medium. Images destined for print require a far higher resolution than those meant to be viewed on a monitor or projected onto a screen. Insufficient image resolution in a medium that demands a higher ppi value will result in poor quality reproduction simply because there are not enough local image samples (pixels) to create a clear representation of the recorded image (Kasdorf 2003). Vector graphics, in contrast, are composed of mathematically-derived line segments that together form paths. Because the basic elements of vector art are linear, this form of digital illustration is particularly well-suited for the creation of line drawings. The shape of a path is controlled by the user through the placement of anchor points and the manipulation of handles that pass through the anchor points which in turn control the length and curvature of the path segment that passes through the point. Because vector-based illustrations are generated in accordance with mathematical coordinates, not pixels, they are said to be resolution-independent. A vector illustration will print as smooth and sharp as the output device will allow: artwork printed on a 1200 dots per inch (dpi) imagesetter employing photographic paper will have smoother lines and tones and greater detail than the same image printed on a 600 dpi laser printer. In addition, they can be scaled up or down without any loss of detail. The linear nature of vector graphics, the ability to edit the course and qualities of paths at any time in the creative process, and their resolution independence make this method ideally suited for technical line illustration. However, there is a steep learning curve associated with vector graphics programs that may dissuade users from adopting this approach. Raster image editors, by comparison, employ familiar-looking image-editing tools such as brushes, pencils and erasers that act like their analog counterparts and are immediately accessible to novice users. Vector-based software, in contrast, relies primarily on a pen tool that operates unlike any traditional drawing instrument and utilizes an indirect technique for the creation of image elements. While tracing a photograph using this type of tool may seem awkward compared with the direct approach of pen on paper, once the initial learning curve is overcome, digital vector drawing is a flexible, fast, and forgiving rendering technique. Tracing the silhouette profile All currently available professional-level image creation programs utilize a layer-based strategy for the creation and modification of image elements. Creating an illustration using layers is similar to making a picture by drawing each of the different elements on individual stacked sheets of transparent paper (see Figure 5). Related elements of the figure should be drawn on separate layers to make path editing and stroke weight adjustments as simple as possible. The silhouette profile of the flaked lithic artifact is drawn on its own layer as a continuous closed path, capturing as much detail of the tools outline as possible. The path should be drawn at a high level of magnification in order to capture all details of edge retouching and wear. Tracing the internal flake scar borders Flake scars on lithic artifacts are the result of purposefully directed pressure or blows from another object, intended to shape the tool. To record the character of the object and to indicate the process of manufacture, it is important that the flake scar borders are captured with accuracy and precision (Morales-Denney, Loynd, and Hansen 2003). Whereas the silhouette profile was created as a single, closed path, the flake scar borders can be rendered as many open paths. It is often difficult to discern all of the flake scar border details from a single photograph and it is recommended that the artifact be available at this stage for direct observation. By moving it under a light source it is much easier to resolve areas of ambiguous structure. If it is not possible to have the artifact available, it is advisable to have a number of photographs showing the tool illuminated from various angles. Each photograph can be place in an individual layer, and can be viewed separately by manipulating layer visibility. Drawing the flake ripple marks Each flake scar is characterized by ripple marks that record the wave of force that passed through the material when the flake was removed. The orientation of the ripple marks is a meaningful indicator of the direction in which the wave of force was moving: the convex edge of each ripple points away from the origin of the force. When drawing a flaked lithic artifact, it is important to capture this detail as it speaks so clearly to the method of the artifacts creation. The lines drawn to represent the ripple marks can also be used to shade the object and give some indication of the nature of the material from which the tool was constructed (see Addington 1986; Martingell and Saville 1988). Up to this point, the entire rendering process has been achieved using the digital vector tracing technique. As a result, the illustration can be scaled in any direction without degradation of image quality, and printed at any size. The ripple marks can also be rendered as a series of discrete paths, preserving the scalability of the image. However, the ripple marks require the greatest subtlety of rendering, and often benefit, in terms of visual complexity and communicativeness, from line work that is varied in stroke weight (lines that taper to a point). Varying line weight in this way allows the illustrator to create a much more refined perceived tonal range when shading the tool to demonstrate its three-dimensional form. Such line weight variation can be created digitally using pressure-sensitive drawing tablets, or by manipulating each line element individually to achieve the tapered appearance. Another approach involves finishing the illustration by hand using traditional media. If this path is chosen then the vector file created to this point (silhouette profile and internal flake scar borders) should be scaled to twice the size at which it will be eventually published. This image can then be printed onto one-ply plate finish bristol board, and the surface details can be drawn onto it directly by hand, first in pencil and then finished in ink. Alternatively, the printed vector image can be traced onto drafting vellum, and the silhouette profile, internal flake scar borders, and ripple marks can all be finished using traditional pen and ink. The ink can be applied with either a fixed-width technical pen, or a split nib pen to achieve line weight variation. Conclusion The digital vector rendering technique is in many ways an updated consideration of the photo-drawing technique put forward by Sterud and Bohlin (1976). It offers a way to trace directly onto a photograph without having to process light-sensitive media. Vector tracing is initially challenging, but ultimately produces an editable, scalable image that can easily be repurposed for publication at different sizes and in a variety of media. While the vector tracing method for capturing the main structural features of a stone tool can be very effective, in many cases it is most expedient to finish rendering the surface detail by hand. Should the illustrator choose to extend the digital technique described and complete the entire image digitally, the image in its final form would be editable, and resolution-independent. References Addington Lucille R. 1986 Lithic Illustration: drawing flaked stone artifacts for publication. Chicago: University of Chicago Press. Adkins, Lesley 1989 Archaeological Illustration. Cambridge: Cambridge University Press. Andrefsky W 2005 Lithics: macroscopic approaches to analysis. Cambridge: Cambridge University Press. Corsiglia, Jennifer., and Martin D. Rosen 1987 “Stone artifacts,” in Dillon, Brian D., ed., The Student’s Guide to Archaeological Illustrating: Archaeological Research Tools, Volume 1. Los Angeles: Institute of Archaeology, University of California, 131-142. Griffiths, Nick. 1990 Drawing archaeological finds: a handbook. London: Archetype Publications. Jastrzebski, Zbigniew T. 1985 Scientific Illustration. Englewood Cliffs, NJ: Prentice-Hall, Inc. Jessup, Marsha E., and David Mascaro 2003 “Light on Form,” in Hodges, Elaine R. S. ed., The Guild Handbook of Scientific Illustration Second Edition. Hoboken, NJ: John Wiley & sons, 89-110. Kasdorf, William E. 2003 The Columbia guide to digital publishing. New York: Columbia University Press. Lavendel, Larry. 2003. “Introduction to computer graphics,” in Hodges, Elaine R. S. ed., The Guild Handbook of Scientific Illustration Second Edition. Hoboken, NJ: John Wiley & sons, 218-246. Lutz Bruce J., and Daniel L. Slaby 1971 “A simplified method for photographing obsidian,” American Antiquity. 37(2): 262-263. Martingell, Hazel and Alan Saville 1988 “The illustration of lithic artefacts: a guide to drawing stone tools for specialist reports,” The Lithics Studies Society Occasional Paper no. 3 and the Association of Archaeological Illustrators and Surveyors Technical Paper no. 9: 1-30. Morales-Denney, Elizabeth, Jennifer A. Loynd, and Liz A. Hansen 2003 “Illustrating humans and their artifacts,” in Hodges, Elaine R. S. ed., The Guild Handbook of Scientific Illustration Second Edition. Hoboken, NJ: John Wiley & sons, 461-483. Piggott, Stuart 1978 Antiquity depicted: aspects of archaeological illustration. London: Thames and Hudson. Piggott, Stuart 1965 “Archaeological draughtsmanship: principles and practice,” Antiquity 39: 165-176. Prokop, Ernst 1985 “A method to photograph stone tools,” The Journal of Field Archaeology 12 (2): 251-255. Rovner, Irwin 1974 “A simpler simplified procedure for photographing obsidian,” American Antiquity 32(1): 617. Sterud, Eugene L. and Ann-Kristin Bohlin 1976 “Small-find illustration: a combined photographic/line drawing technique,” Journal of Field Archaeology 3(1): 103-110. Toth, Nicholas and Kathy Schick 2007 “Overview of Paleolithic archaeology” in Henke, Winfried and Ian Tattersall, eds., Handbook of Paleoanthropology. Berlin: Springer-Verlag, 1943-1963. Van Reybrouck, David. 1998 “Imaging and imagining the Neanderthal: the role of technical drawings in archaeology,” Antiquity 72: 52-64. Marc Dryer received a Master of Science degree in Paleoanthropology in 1999 and Master of Science degree in Biomedical Communications from the University of Toronto in 2001. Currently, he is a full-time faculty member in the Institute of Communication and Culture at the University of Toronto Mississauga campus in the Biomedical Communications unit. His research interests include 3D biomedical visualization, 3D forensic craniofacial reconstruction, and advanced visual media for anthropological data.marc.dryer@utoronto.ca Dave Mazierski received a Bachelor of Science degree in Art as Applied to Medicine from the University of Toronto in 1982, and an M.Sc. in Ecology & Evolutionary Biology in 2008. He is currently an Associate Professor in Biomedical Communications, in the Institute of Communication and Culture, University of Toronto at Mississauga. He teaches foundation courses in traditional and digital media production and illustration, as well as undergraduate courses in scientific visualization. His current research interests include the history of paleontological illustration and the evolution of herbivory in early terrestrial vertebrates. d.mazierski@utoronto.ca
|
|
Copyright
2009, The Journal of Biocommunication, All Rights Reserved |